Unexpectedly bad results from animation performance tests published in Turbo Make Games channel forced me to closely look into the internals of skinned mesh renderer implementation of Entities.Graphics.
Firstly I want to summarize the main architectural features of the skinned mesh renderer (SMR) implementation of the Entities.Graphics library:
- Despite popular belief, skinned meshes are correctly frustum culled just like static meshes.
- Skinning performed on GPU using compute shader. Skinning results (which consist of position, tangent, and normal) are written into compute buffers. Rendering passes use a special deformation-aware shader that reads this deformed data per instance and uses it for vertex placement instead of original mesh vertices.
- Blend shape blending is very similar to skinning, but instead of modifying vertex positions by skin matrices, it uses blend shape targets.
- Because the skinning process requires an intermediate deformation buffer, there is one architectural flaw in the current implementation. When a count of skinned vertices reaches hardware-dependent compute buffer capacity, various visual glitches, slowdowns, and even driver crashes appear.
- A High-level view of the entire skinning algorithm is followed. SkinMatrix buffer exposed as entity dynamic buffer is filled by user code (
Rukhanka Animation Systemdoes this by sampling and blending animations).PushSkinMatrixSystemreads this buffers from entities and copies data into a single compute buffer.InstantiateDeformationSystemcopies static mesh data into a deformation compute buffer duplicating it for every instanced model.SkinningDeformationSystemdispatches compute shader for each unique mesh which reads all prepared data and calculates all skinned vertex positions for all skinned mesh instances. - There is no frustum and/or occlusion culling for this process. Skin deformation calculation is performed for every mesh instance in every frame.
So, according to recent public performance tests, there is very little improvement between many visible object count and a few (compare "Static Entities" and "Static GameObjects" rows of comparison tables. "Static Entity" is just plain skinned mesh renderer converted and handled by Entities.Graphics). We already know that frustum culling is working for SMR, so rendering is not an issue here. BatchRenderGroup (Entities.Graphics is based on this API) effectiveness is proven by numerous massive static object sample scenes/projects. We also know that skinning is performed for every mesh regardless of its position relative to the camera (visible/invisible). We need to dig into Entities.Graphics internals to find the root of bad performance.
Test environment
I have made a simple test scene for my measurements. It consists of a small pack of unique low polygon forest creatures.
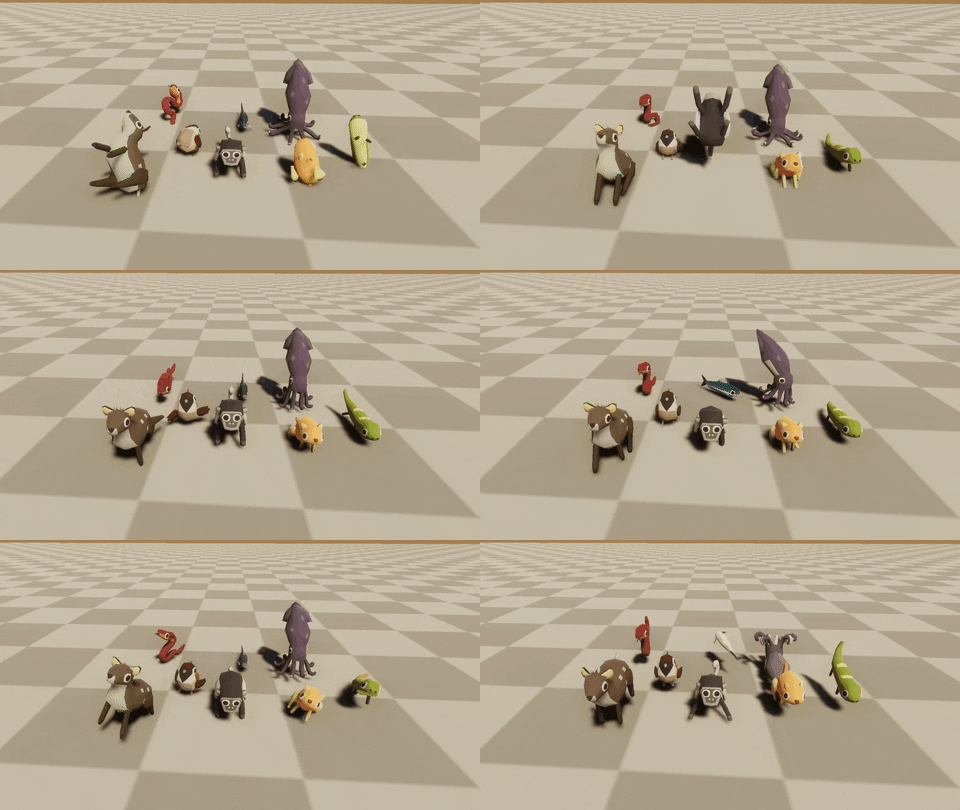
In these tests, no animations (and animation libraries) are used for the models.
Each measurement is performed on the scene with 50,000 creatures spawned as entities. Each entity consists of one skinned mesh renderer and a simple bone hierarchy. Measured two scene states:
Full View- all instances are in front of the camera: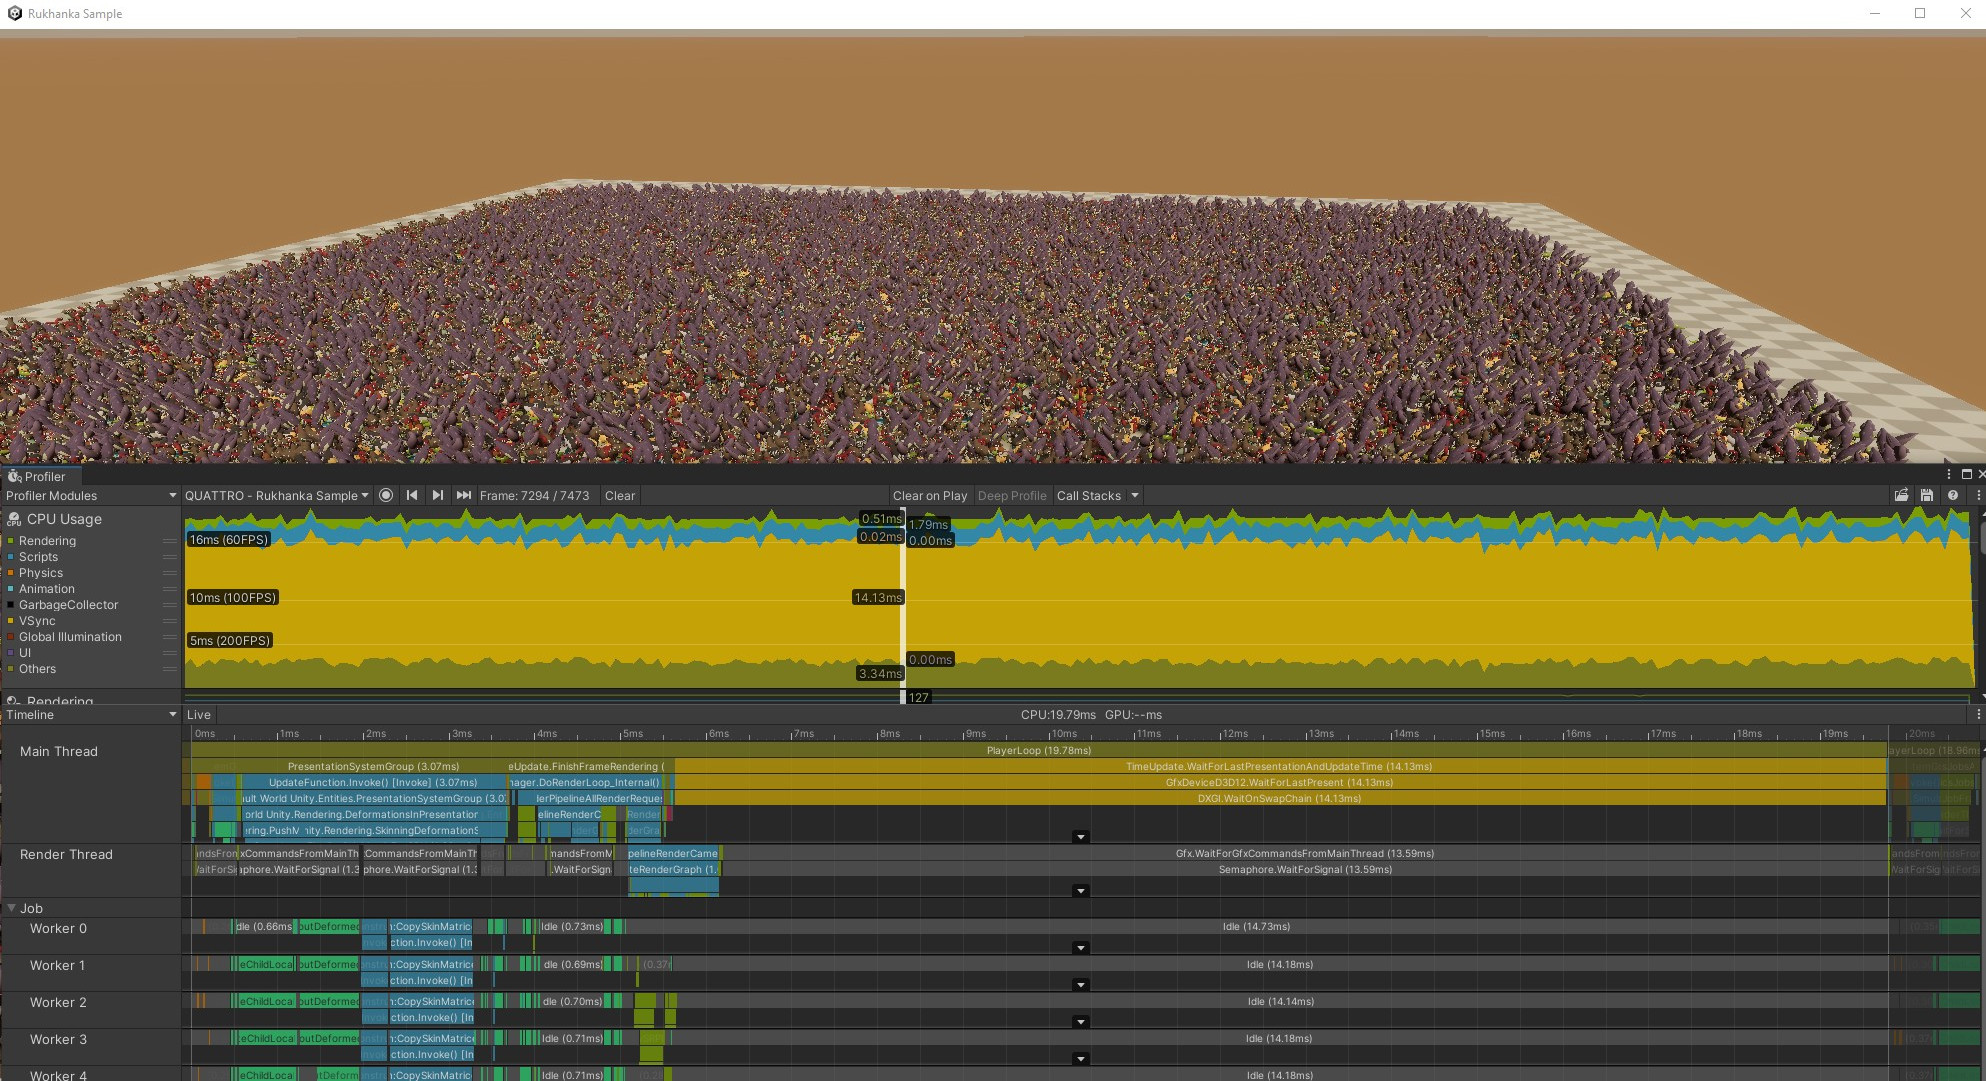
- And
Empty View- all instances are not visible to the camera: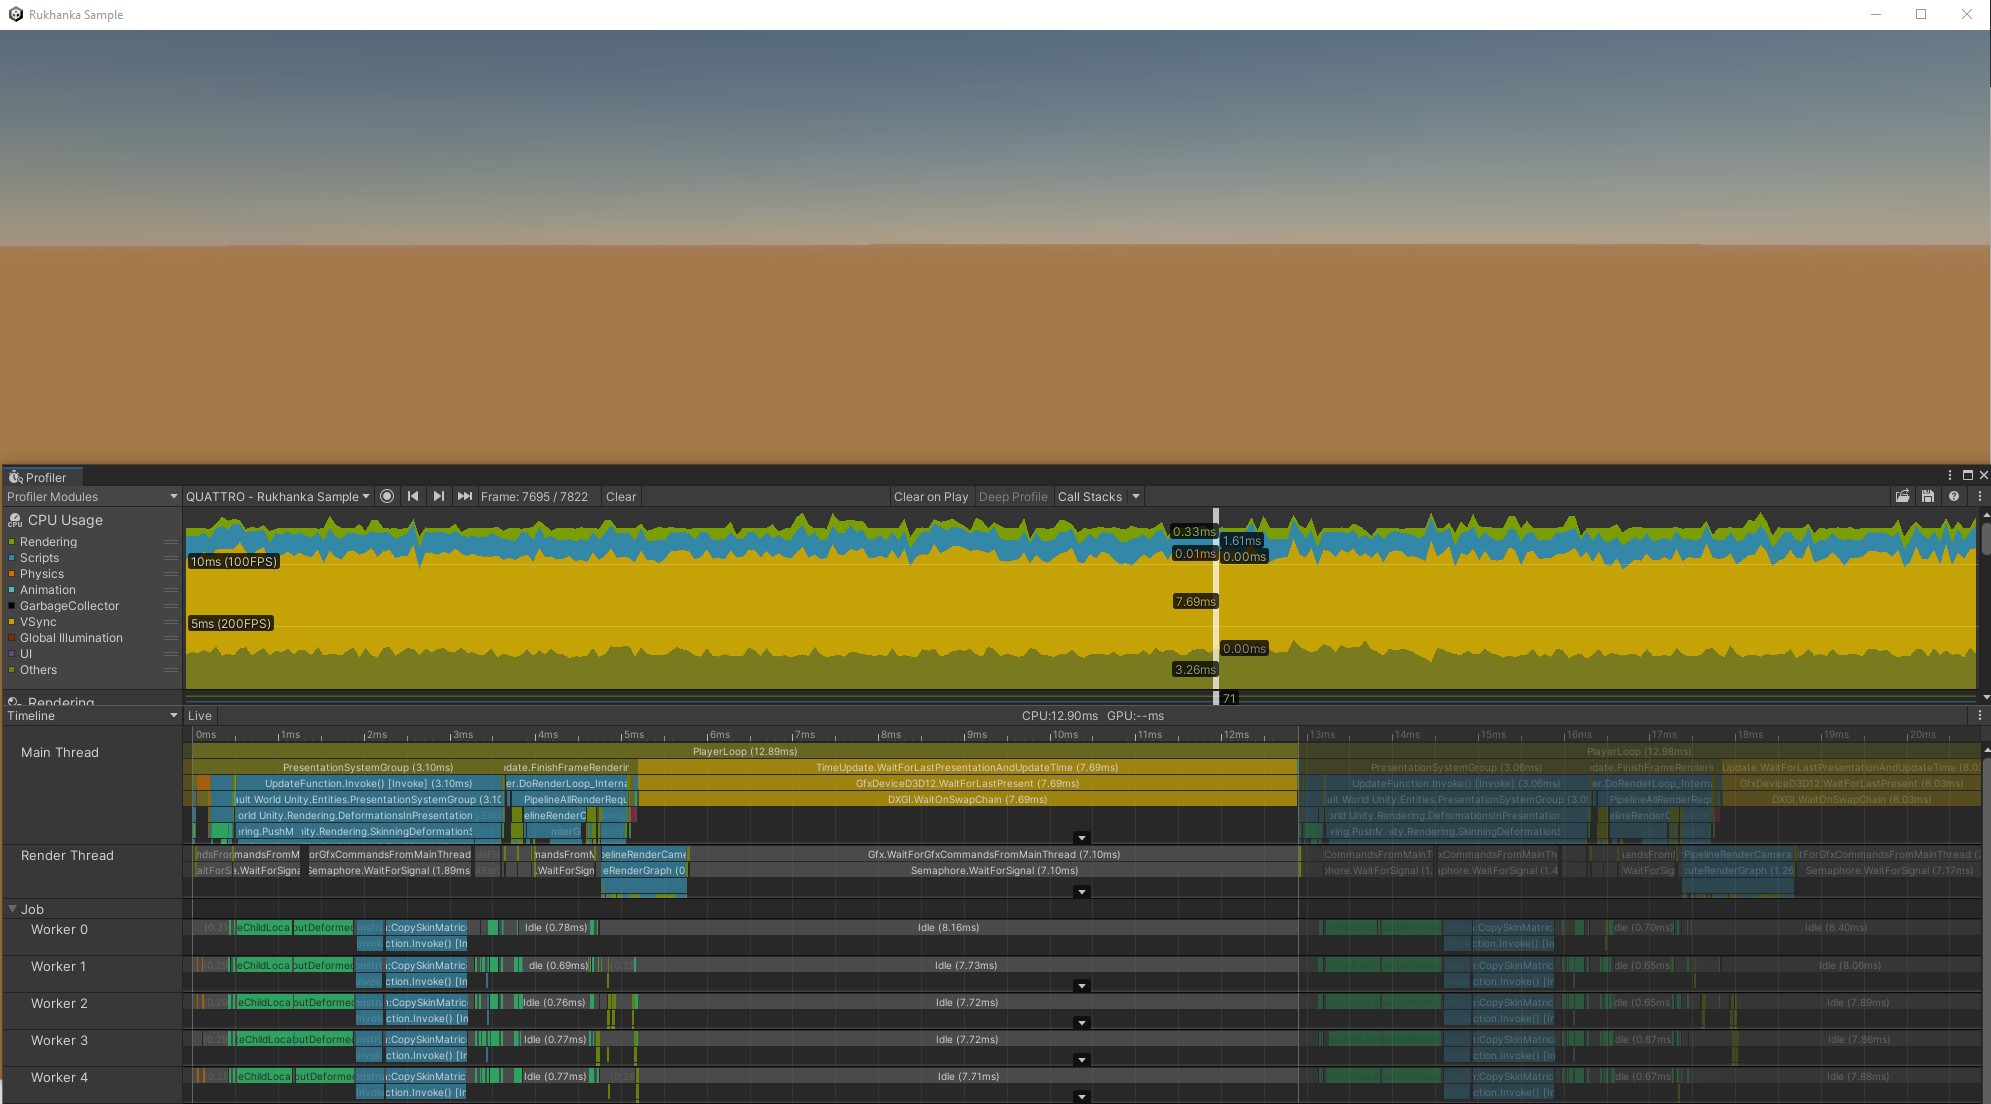
Measurements were recorded using scene build (not in the editor). Hardware is: AMD Ryzen9 7950X, RTX 3070Ti, 64GB Ram.
First observations
The obvious first step is to use Unity Profiler to look at the overall performance picture.
Full View:

Empty View:

From profiler frame data there are several immediately apparent things:
- Test application is heavily GPU bound even in empty view when no mesh instances are rendered:
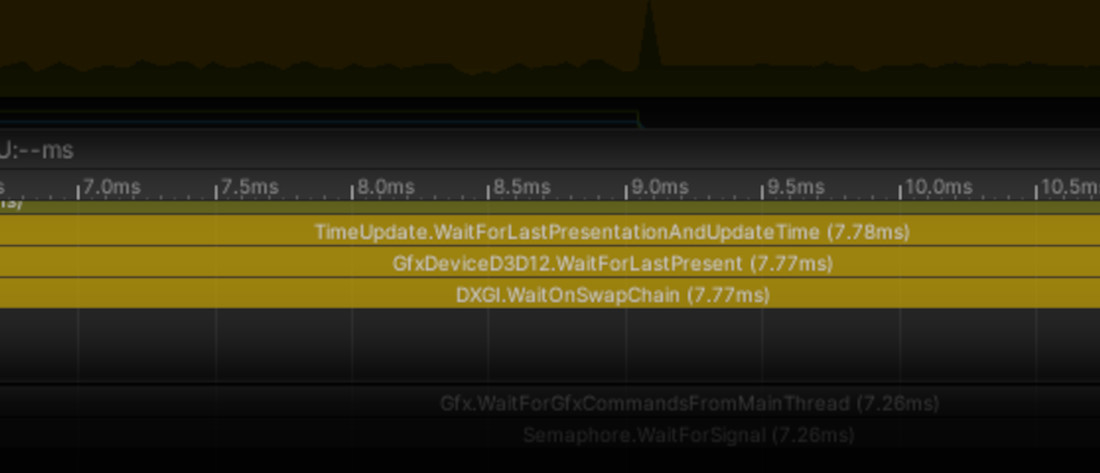
- And a big portion of a frame is taken by blue (non-Bursted) jobs:
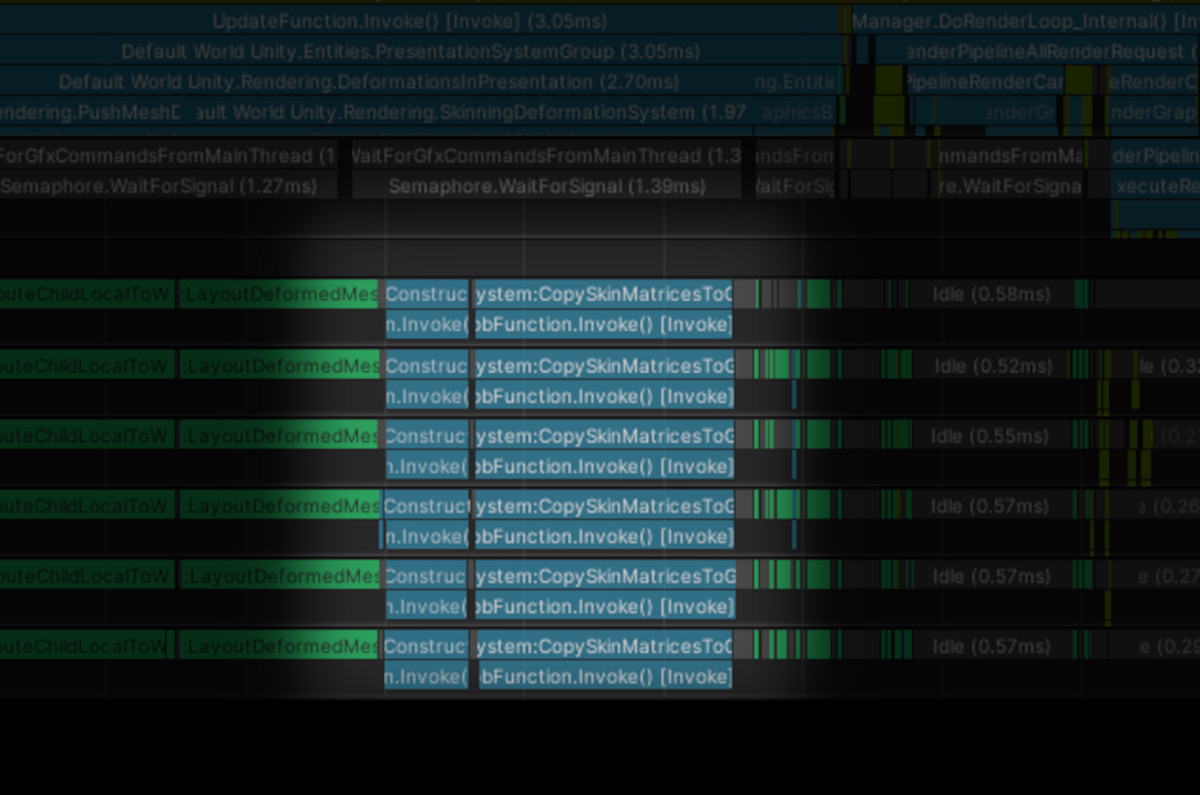
Trivial improvements
First credit goes to @Tertle, who is famous for digging into the depths of ECS packages and finding various optimization opportunities. He discovered that PushSkinMatrixSystem jobs are fully Burst compatible, but did not have [BurstCompile] attribute. I also made this change and, despite that they are very simple jobs, got a small performance improvement:
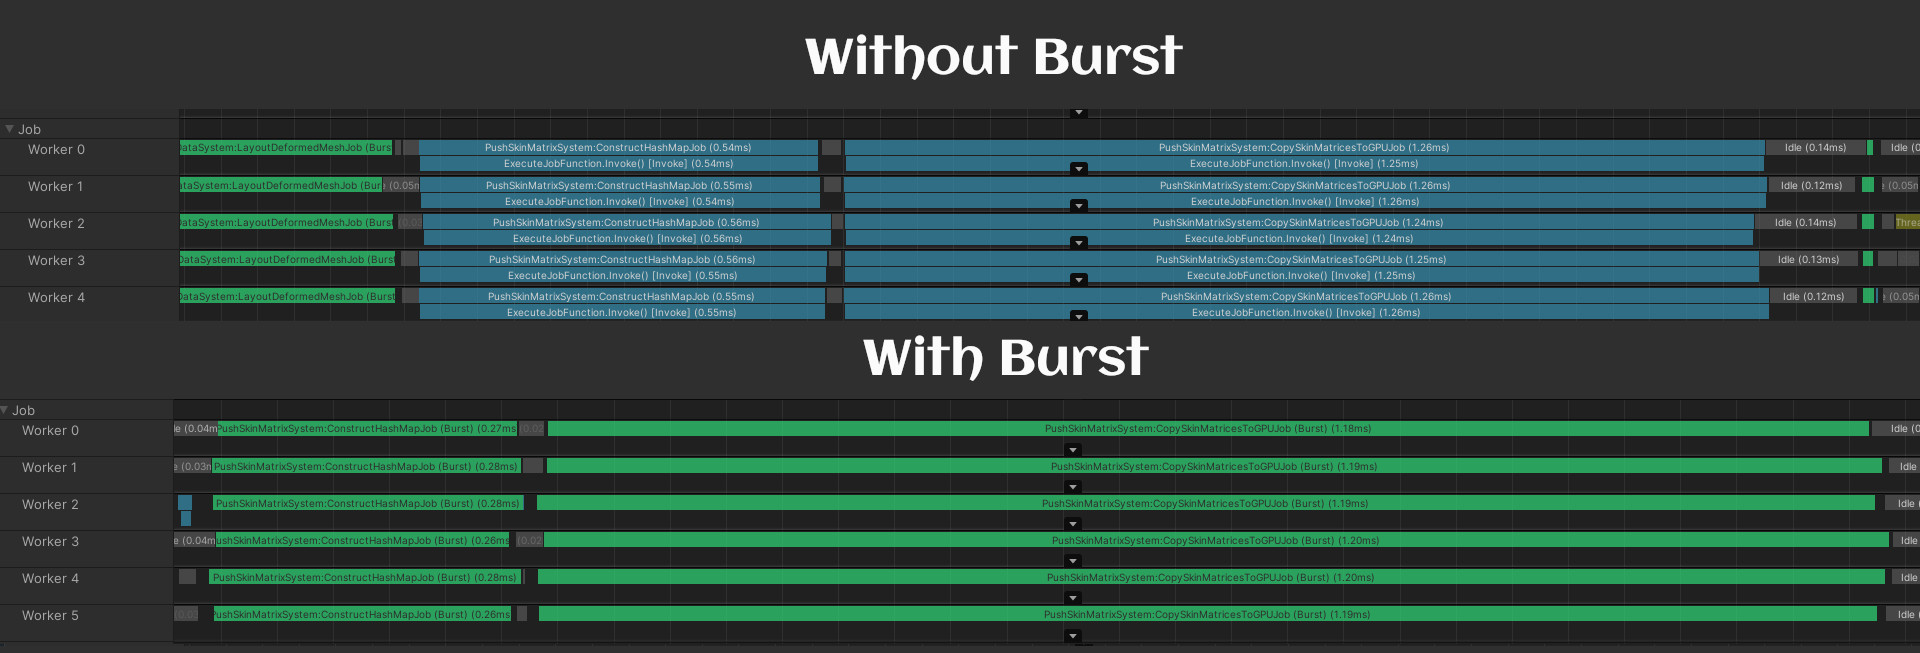 Negligible changes in
 CopySkinmatricesToGPUJob are explained by the fact that this job does only memory copies via UnsafeUtility.MemCpy.
The fastest code is the code that never runs
The biggest problem is still that the application is GPU-bound even without visible objects. To profile GPU I use NVIDIA Nsight Graphics:
Full View:
Empty View:
Rendering of all instances takes less than half of the GPU frame time! With no visible objects almost the whole frame time is taken by some compute shaders. Analyze them. More than half the time taken by InstantiateDeformationDataKernel dispatches. This is a very simple shader that just copies shared mesh vertex positions into a compute buffer for each mesh instance:
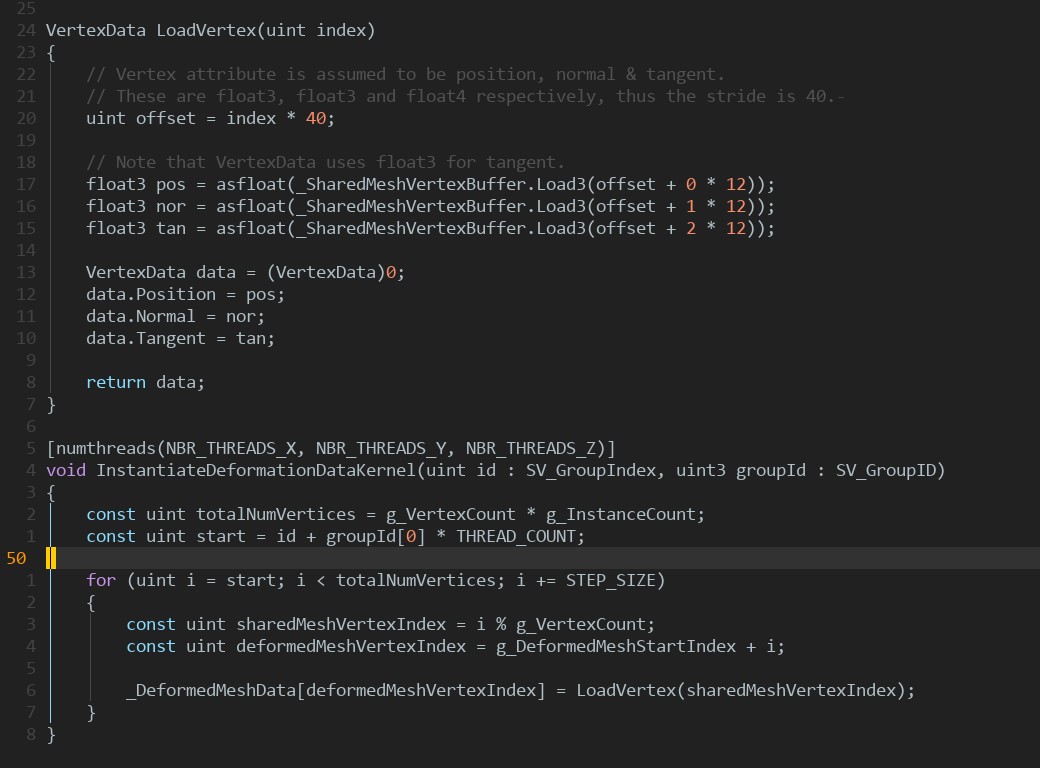
Because of the high number of instances (and as a result big vertex count), copying is a heavy memory operation. On subsequent skinning or blend shape application passes each vertex position is read and modified by the skin matrix/blend shape position. But why this initial copy is even needed? Initial mesh data can be directly read from original mesh buffers. With the complete removal of InstantiateDeformationSystem and slight changes in the skinning compute shader we will get a decent performance boost:
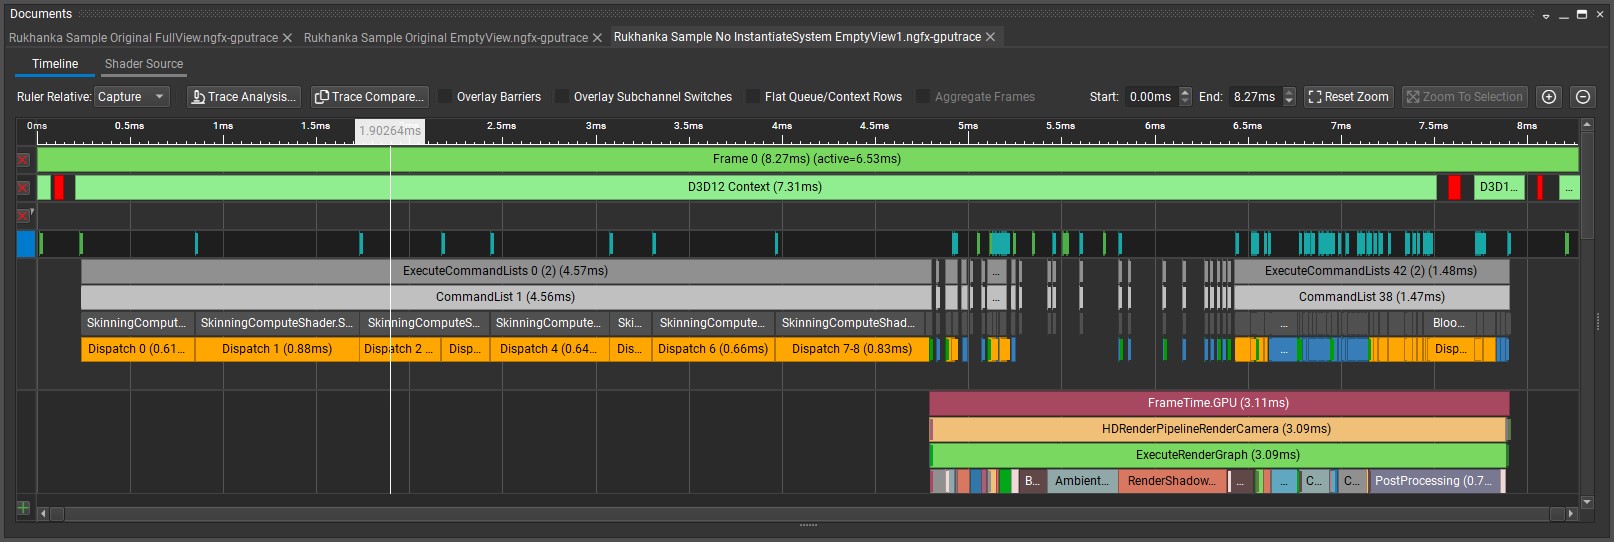
Now deformation compute shaders take 4.56ms instead of 14.4ms.
Optimization of shader bottlenecks
The next heavy part is the skinning compute shader. It also contains simple code. For every skinned vertex, simple loop applies skin matrices to it and the result is written to output the deformation buffer. NVIDIA Nsight has shader profiling functionality so we will use it:
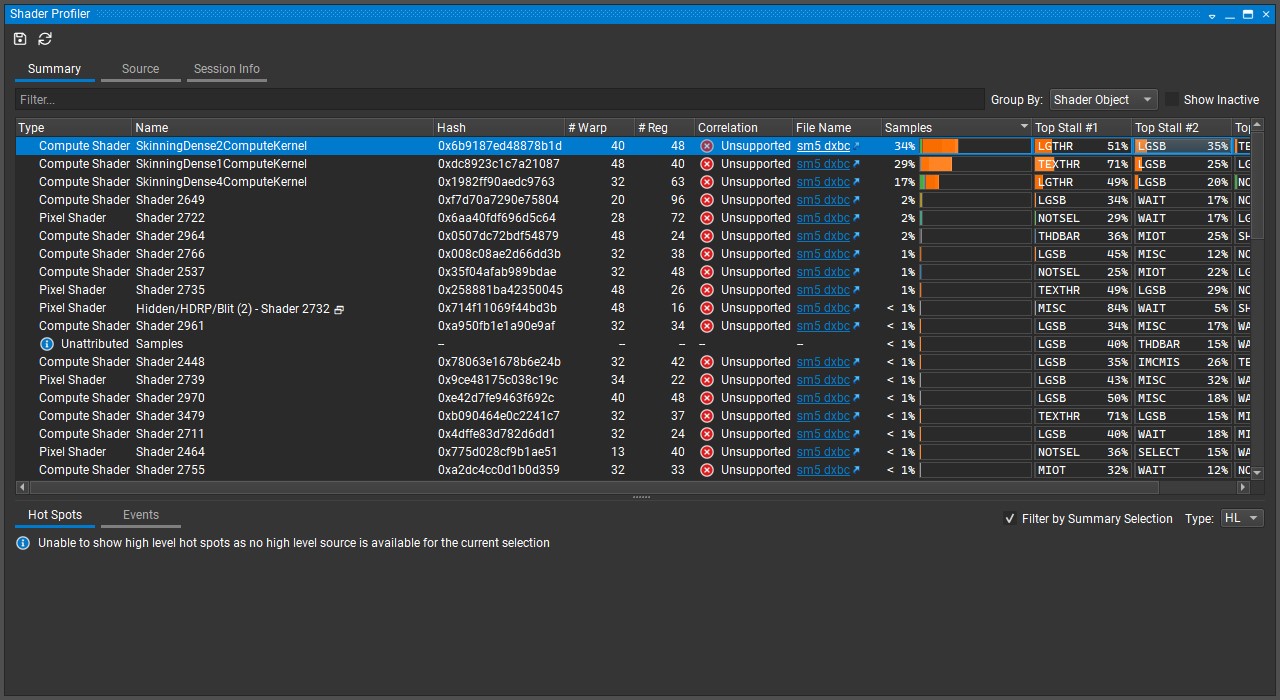
According to profiler, results compute shaders are stalled by:
- LGTHR - LG Throttle : Input FIFO to the LSU pipe for local and global memory instructions is full.
- TEXTHR - TEX Throttle : The TEXIN input FIFO is full.
- LGSB - Long Scoreboard : Waiting on data dependency for local, global, texture, or surface load.
Skinning shader doesn't use many temporary registers, so these are all global memory access-related performance counters. One of the advices found in documentation proposes 'To optimize buffers and group shared memory, use manual bit packing. When creating structures for packing data, consider the range of values a field can hold and choose the smallest datatype that can encompass this range'. We will try this approach.
Bone skinning data is transferred to the final mesh shader in the form of an array of vertices represented by this struct:
struct VertexData
{
    float3 Position;
    float3 Normal;
    float3 Tangent;
};
36 bytes in total. I will make an approximation that the skinned mesh pose did not differ much from the static mesh pose. This is of course not always true (non-inplace animations can diverge significantly), so the following optimization should be carefully tested for visual issues on final animations. Skin vertex positions can be stored as half-precision floating point numbers and encoded as delta between original and deformed positions. The new vertex offset structure has the following declaration:
struct CompressedVertexDelta
{
    uint field0, field1, field2, field3, field4;
}
20 bytes in total. This is 10 half values. One extra half is needed to correctly pad data (it needs to be 4-byte aligned). Using f32tof16 and f16tof32 shader instructions we can encode and decode our new compressed data.
float3 DecodePosition(CompressedVertexDelta v)
{
    float x = f16tof32(v.field0 >> 16);
    float y = f16tof32(v.field0);
    float z = f16tof32(v.field1 >> 16);
    return float3(x, y, z);
}
...
void EncodePosition(inout CompressedVertexDelta v, float3 pos)
{
    uint px = f32tof16(pos.x);
    uint py = f32tof16(pos.y);
    uint pz = f32tof16(pos.z);

    v.field0 = px << 16 | py;
    v.field1 = pz << 16;
}
After shader changes, we have got following performance characteristics:
Full View: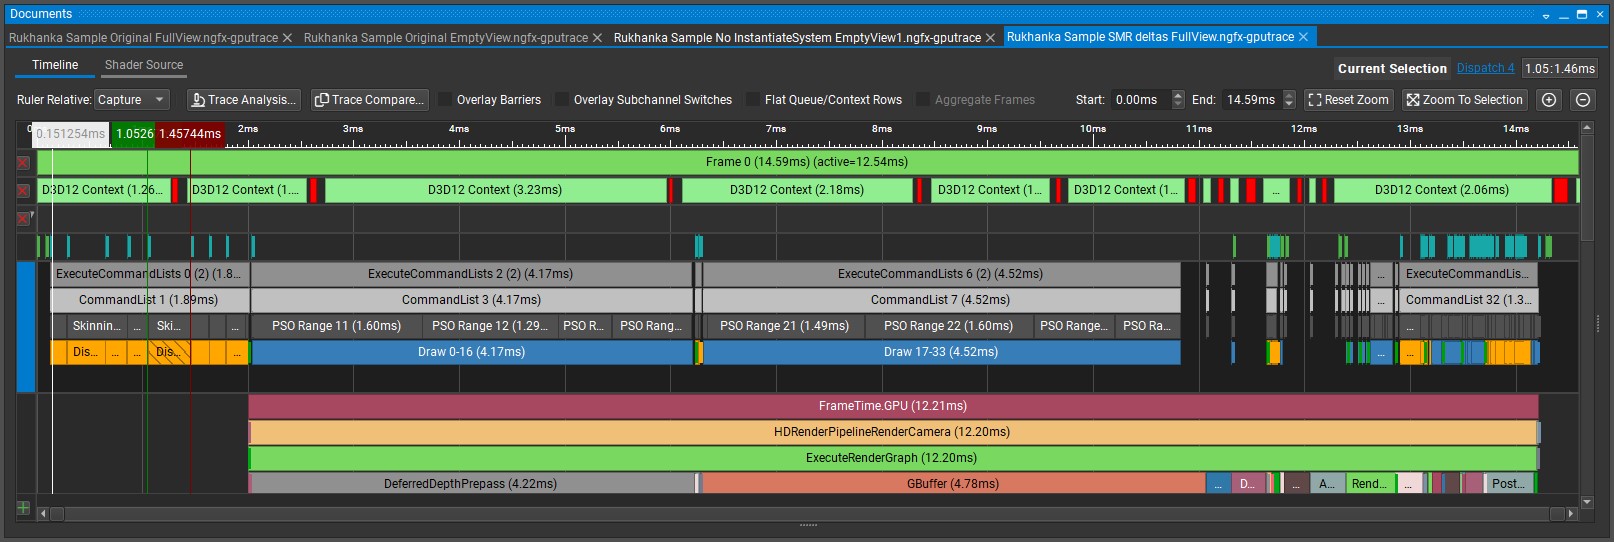
Empty View: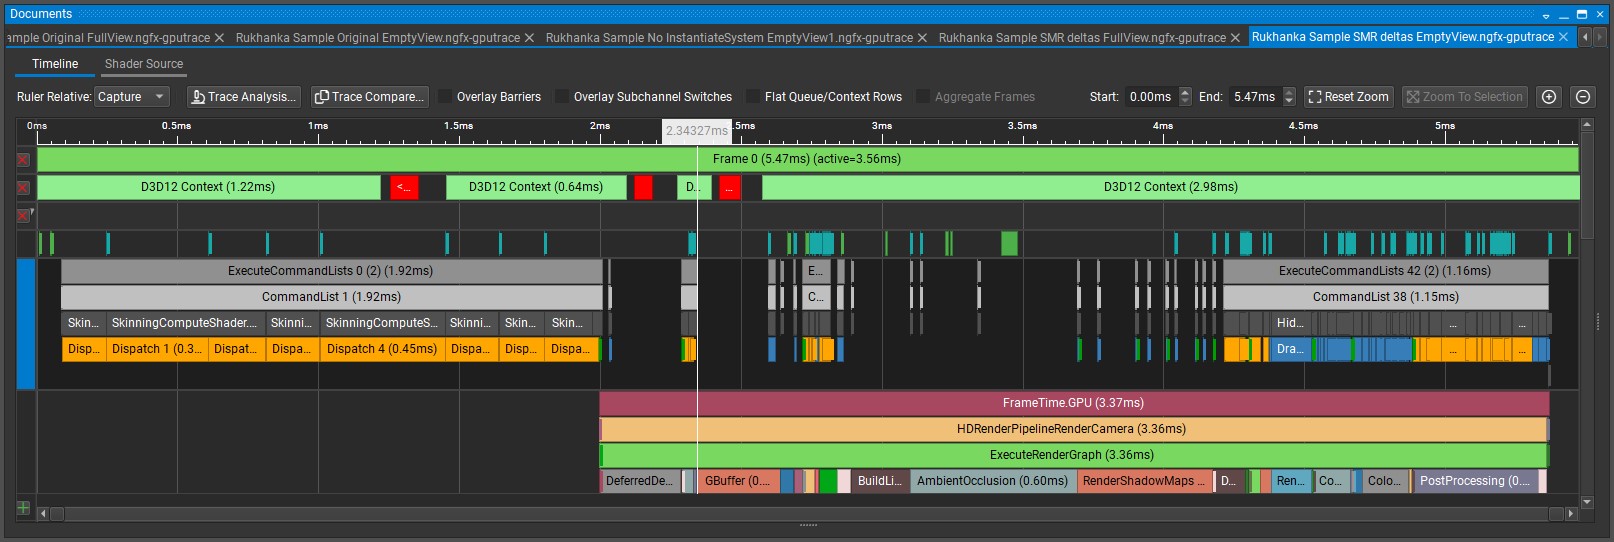
And unity profiler:
Full View: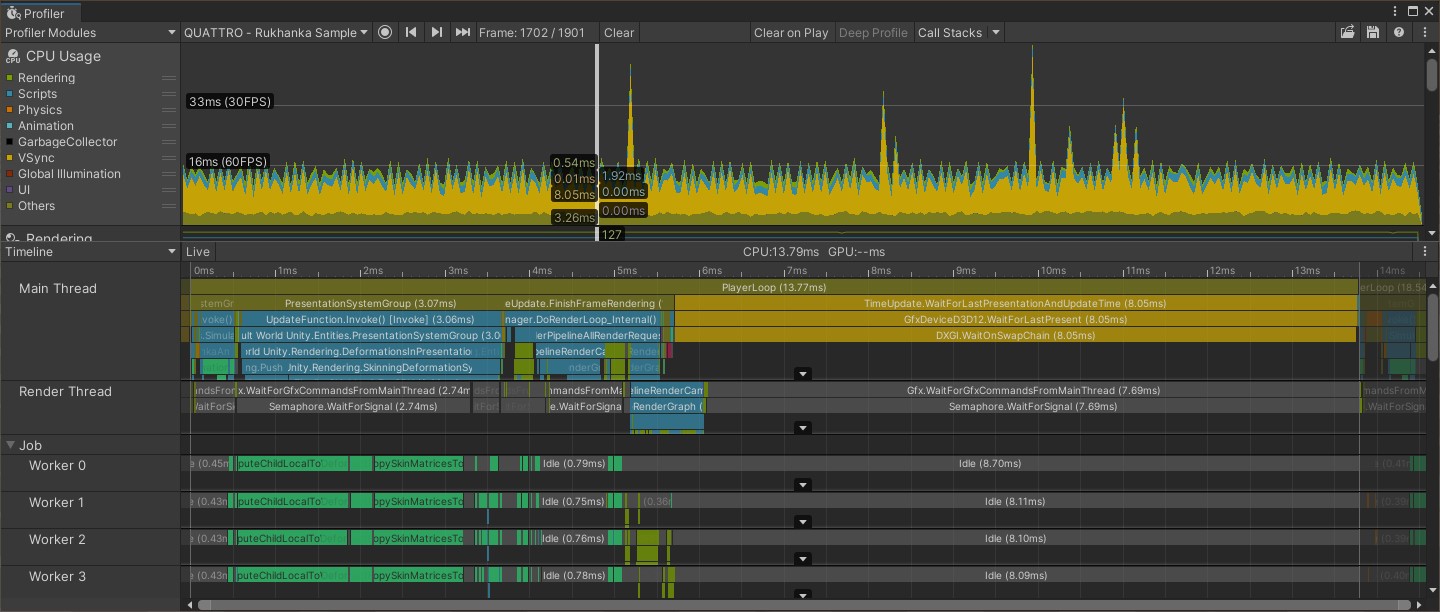
Empty View: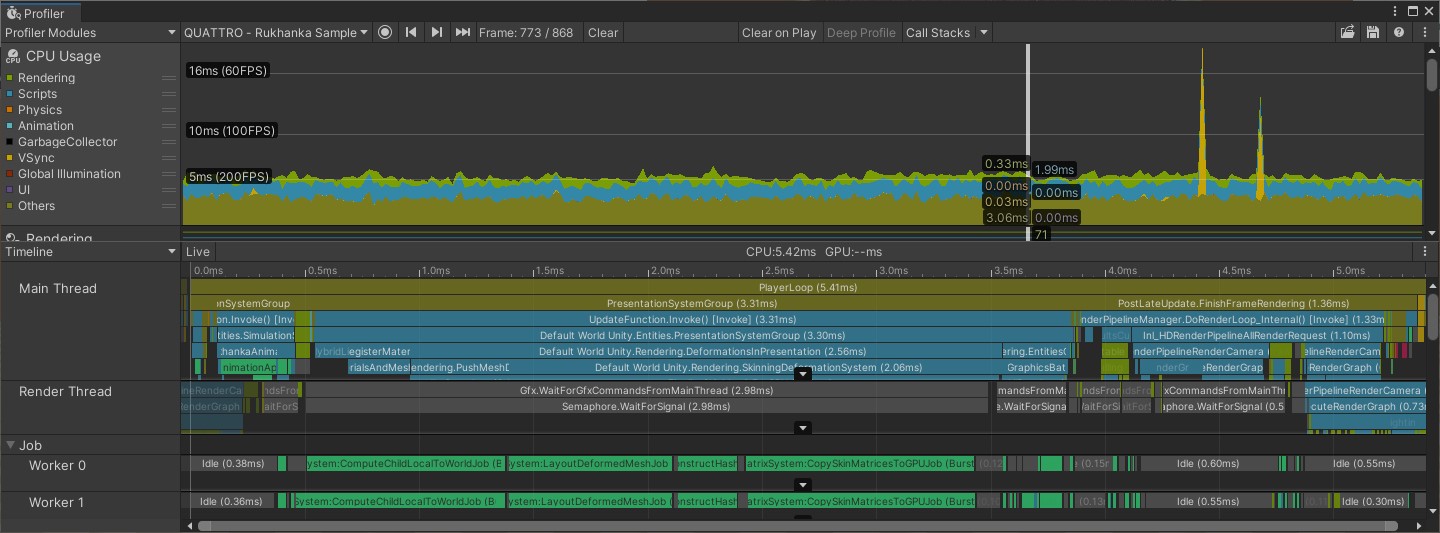
Results
Full View frame time | Empty View frame time | Improvement from base | |
|---|---|---|---|
| Original Renderer | 26.1ms | 17.6ms | 100% / 100% |
| Without InstantiateDeformationSystem | 17.3ms | 8.3ms | 150% / 212% |
| Skin data compression | 14.6ms | 5.5ms | 179% / 320% |
With frustum and occlusion culling techniques (which need to be implemented), skinning application and processing can be reduced further. It is very important for situations when many skinned meshes are not visible in the current frame.